Electricity prices are not fixed. They depend on the amount of power generation capacity and demand. In the Netherlands we have a hourly price, which is determined one day in advance. Some power suppliers offer so called ‘dynamic’ contracts, where these hourly prices are used for billing, instead of a fixed price. I like it: you become more aware of your consumption, learn something about prices patterns of electricity and save (a little) on costs.
In this blog post, I will show you how electricity prices have changed over time and calculate the potential of shifting your demand.
Historical prices
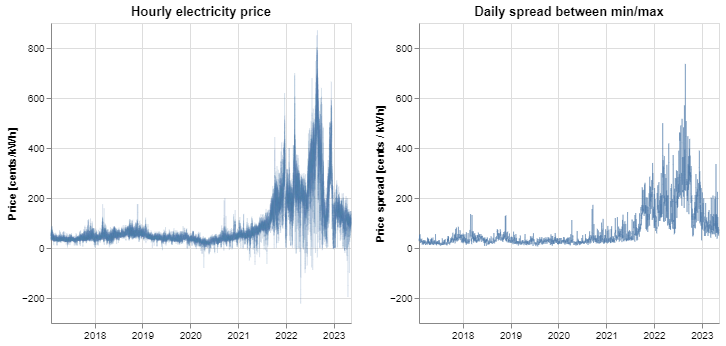
From 2021 onwards things have been ‘interesting’! There are huge swings in the prices, both between the days, but also within the days. In 2023 so far prices have dropped.
The highest spread was at August 28th 2022, with a minimum price at 15:00 of -37 cents per kiloWatt-hour (kWh). At 20:00 the price was 699 cents/kWh!
Which days are most expensive (or cheap)?
Prices are lowest on Sundays. Apparently a good day to do the laundry!
Which hours are most expensive (or cheap)?
C:\Users\Gebruiker\AppData\Local\Temp\ipykernel_13176\3753049483.py:2: FutureWarning: The default value of numeric_only in DataFrameGroupBy.mean is deprecated. In a future version, numeric_only will default to False. Either specify numeric_only or select only columns which should be valid for the function.
  test = df[df['year']==2022].groupby('month').mean()['price'].reset_index()
C:\Users\Gebruiker\AppData\Local\Temp\ipykernel_13176\302183373.py:2: FutureWarning: The default value of numeric_only in DataFrameGroupBy.mean is deprecated. In a future version, numeric_only will default to False. Either specify numeric_only or select only columns which should be valid for the function.
test = df[df['year']==2023].groupby('month').mean()['price'].reset_index()On average, the prices are highest at 8:00 and 19:00, and lowest at 3:00 and 13:00. I learned this is called a duck curve.
This graph is another way of looking at it. The line shows that on average the price at 19:00 is 80% of the maximum price that day.
The heatmap shows this 80% at 19:00 is a result of it often being the most expensive price of the day (the dark blue square). But not always, otherwise it would be 100%.
If we compare the normalized prices 2022 with 2017 we see a couple of changes: The lowest prices used to be at night but are now at 13:00. In addition, 19:00 is even more often the highest price of the day.
How much can you save by shifting your electricity demand?
Some of your electricity consumption is not flexible. Some devices never turn off (e.g. refrigerator). Some consumption is not easy to move in time (e.g. when you cook).
But some demand is flexible, for example:
- A dish washer (0.5-1 kWh per cycle)
- A washing machine (0.7-1.2 kWh per cycle, add 1-3 kWh with a dryer)
- An electric car (dependent on battery)
Let’s say we can shift 1 kWh daily. Let’s also assume you currently are using that 1 kWh somewhere randomly between 9:00-20:00.
If you would have shifted this demand optimally to the lowest point in the day you would have saved ~€360 in 2022. You could also do it simpler, by always shifting your 1kWh demand to 13:00. Since 2022 this strategy is bringing in ~60% of the optimal strategy. These savings are highly dependent on the actual prices and how much you can shift from which hour.
Takeaways
- Shift your flexible demand as much as possible to 13:00, preferably in the weekend. Electricity is cheapest and CO2 emissions are much lower due to solar production.
- This simple rule of thumb is already bringing in ~60% of your savings potential.
- Get a dynamic energy contract to actually save this potential yourself. If you have solar panels it works differently with ‘salderen’. Also you do run the risk of paying more when prices increase.
Tip
Two websites I can recommend if you want to know more are:
- CO2 monitor, showing the emissions of our energy usage
- Energieopwek.nl, showing the sources of our electricity
Warning
- Prices can change rapidly, so this historic analysis is not necessarily a good predictor of the future.
- Views on this blog are my personal opinion.